Correlation vs Causation: Reading Gun Statistics Without Getting Fooled
Almost every gun debate eventually turns into a contest of charts: states with more guns have more gun deaths, states with looser laws have less crime, a new law passed and the numbers went down. Each claim may describe a real pattern. Whether one thing actually causes the other is a separate question, and it is where most statistical arguments, from every side, go wrong.
A correlation means two measurements tend to move together. Causation means a change in one actually produces a change in the other. Showing causation requires ruling out the other explanations: a third factor driving both (a confounder, such as poverty, urbanization or age), the arrow running backward (reverse causation, such as people buying guns because crime is rising), coincidence over a short time window, or a change in how something is counted. Researchers try to isolate cause using comparison groups, before-and-after designs and controls for known confounders, and even then they often disagree.
The gun research record shows how hard this is. In 2004 a National Research Council panel reviewed the literature on right-to-carry laws, including John Lott's "More Guns, Less Crime," and concluded the evidence did not establish a causal effect in either direction. The RAND Corporation's ongoing Gun Policy in America project rates the evidence for dozens of policies, and for many it finds the evidence limited or inconclusive. That does not mean policies have no effect; it means the data alone often cannot settle the question, and confident claims deserve scrutiny.
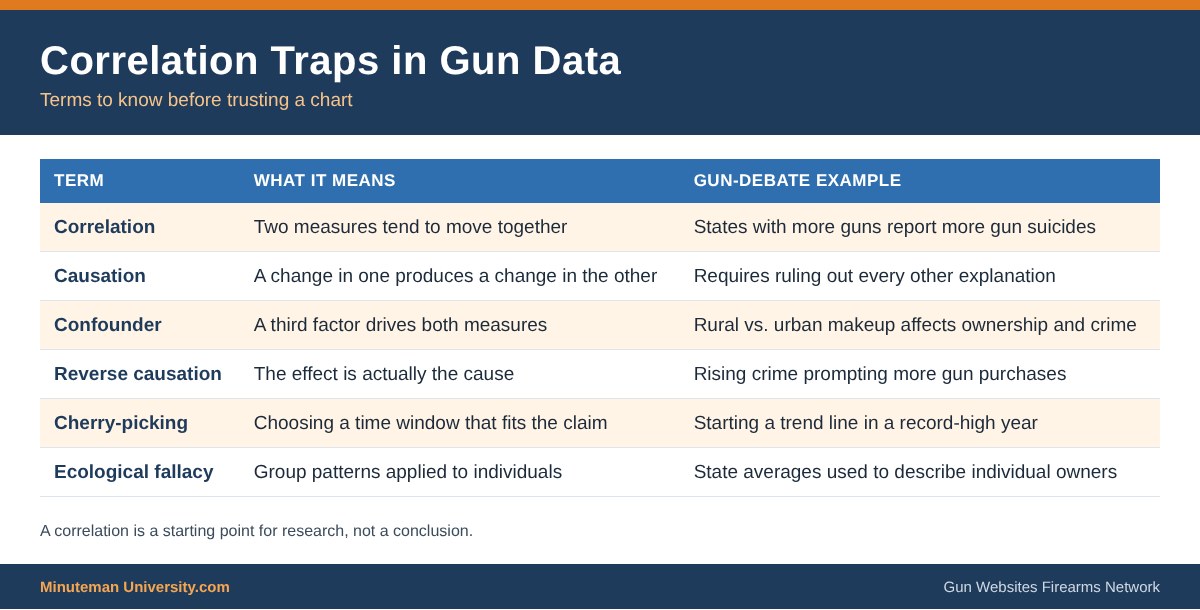
Common Traps in Gun Statistics
- Bundled categories: "Gun deaths" combines suicides, homicides, accidents and justified shootings; CDC data show suicides make up more than half of the total.
- Totals vs. rates: a large state will have more of everything; compare per-capita rates.
- Cherry-picked years: starting or ending a chart in an unusual year can create or erase a trend.
- Ecological fallacy: a pattern among states does not show what individuals in those states do.
- Moving definitions: "school shooting" or "mass shooting" counts vary widely by who is counting.
Questions to Ask About Any Gun Statistic
- Who collected the data, and how is each term defined?
- Is it a total or a rate, and over what years?
- What else changed at the same time (economy, policing, population)?
- Does the study use a comparison group, or only a before-and-after line?
- Have other researchers reached the same result with different data?
Related: Firearm Deaths, Firearm Facts, Fear of Violence, Center for Disease Control, and test your knowledge at Tactical Quiz.com.
Sources
- National Research Council: Firearms and Violence, A Critical Review (2004)
- RAND: Gun Policy in America
- CDC WISQARS Injury Data
“correlation does not imply causation”
Correlation – a change in one variable will typically be mirrored by a positive or negative change in the other
Causation